
Who Supports American Art Museums? Introducing a New Dataset and Data Sources about Museum Funding
PDF: Barabasi and Shekhtman, Who Supports American Art Museums?
Editors’ Note: This article and the responses to it comprise the final “Toward a More Inclusive Digital Art History” project generously funded by the Terra Foundation for American Art. Click on the Toward a More Inclusive Digital Art History tag for all projects in the series.
Introduction
“New Scrutiny of Museum Boards Takes Aim at World of Wealth and Status.” “Warren Kanders Quits Whitney Board after Tear Gas Protests.” “Julie Mehretu Becomes Third Artist Ever to Join Whitney Board.” These are all headlines that have run in the New York Times since 2019.1 Whether condemning how trustees have made their money or celebrating new and diverse perspectives added to boards, they are exemplary of the ways in which the funding of art museums in the United States is, of late, a divisive topic. In many other countries—especially in Europe—governments serve as the main source of support for the arts. In the United States, governmental support largely takes a back seat to funding from private individuals and foundations. Private donors, in particular, play a significant role not only as sources of financial support but also in taking on major governance roles as trustees of institutions.
This funding structure leads to important questions about what roles these donors play in museums and how they influence which works are displayed, institutional priorities, and myriad other issues—in addition to ethical questions about the sources of funds used to support art museums.2 For all the discussion of this topic, however, there is a paucity of data available to inform the conversation. This essay seeks to start rectifying that by showing the ways in which public tax filings of both museums and foundations that donate to museums (often called institutional donors) can create a dataset that allows scholars and cultural commentators to understand better who funds and governs art institutions in the United States. To supplement the tax data, we also use a corpus of museum annual reports that have been published online.
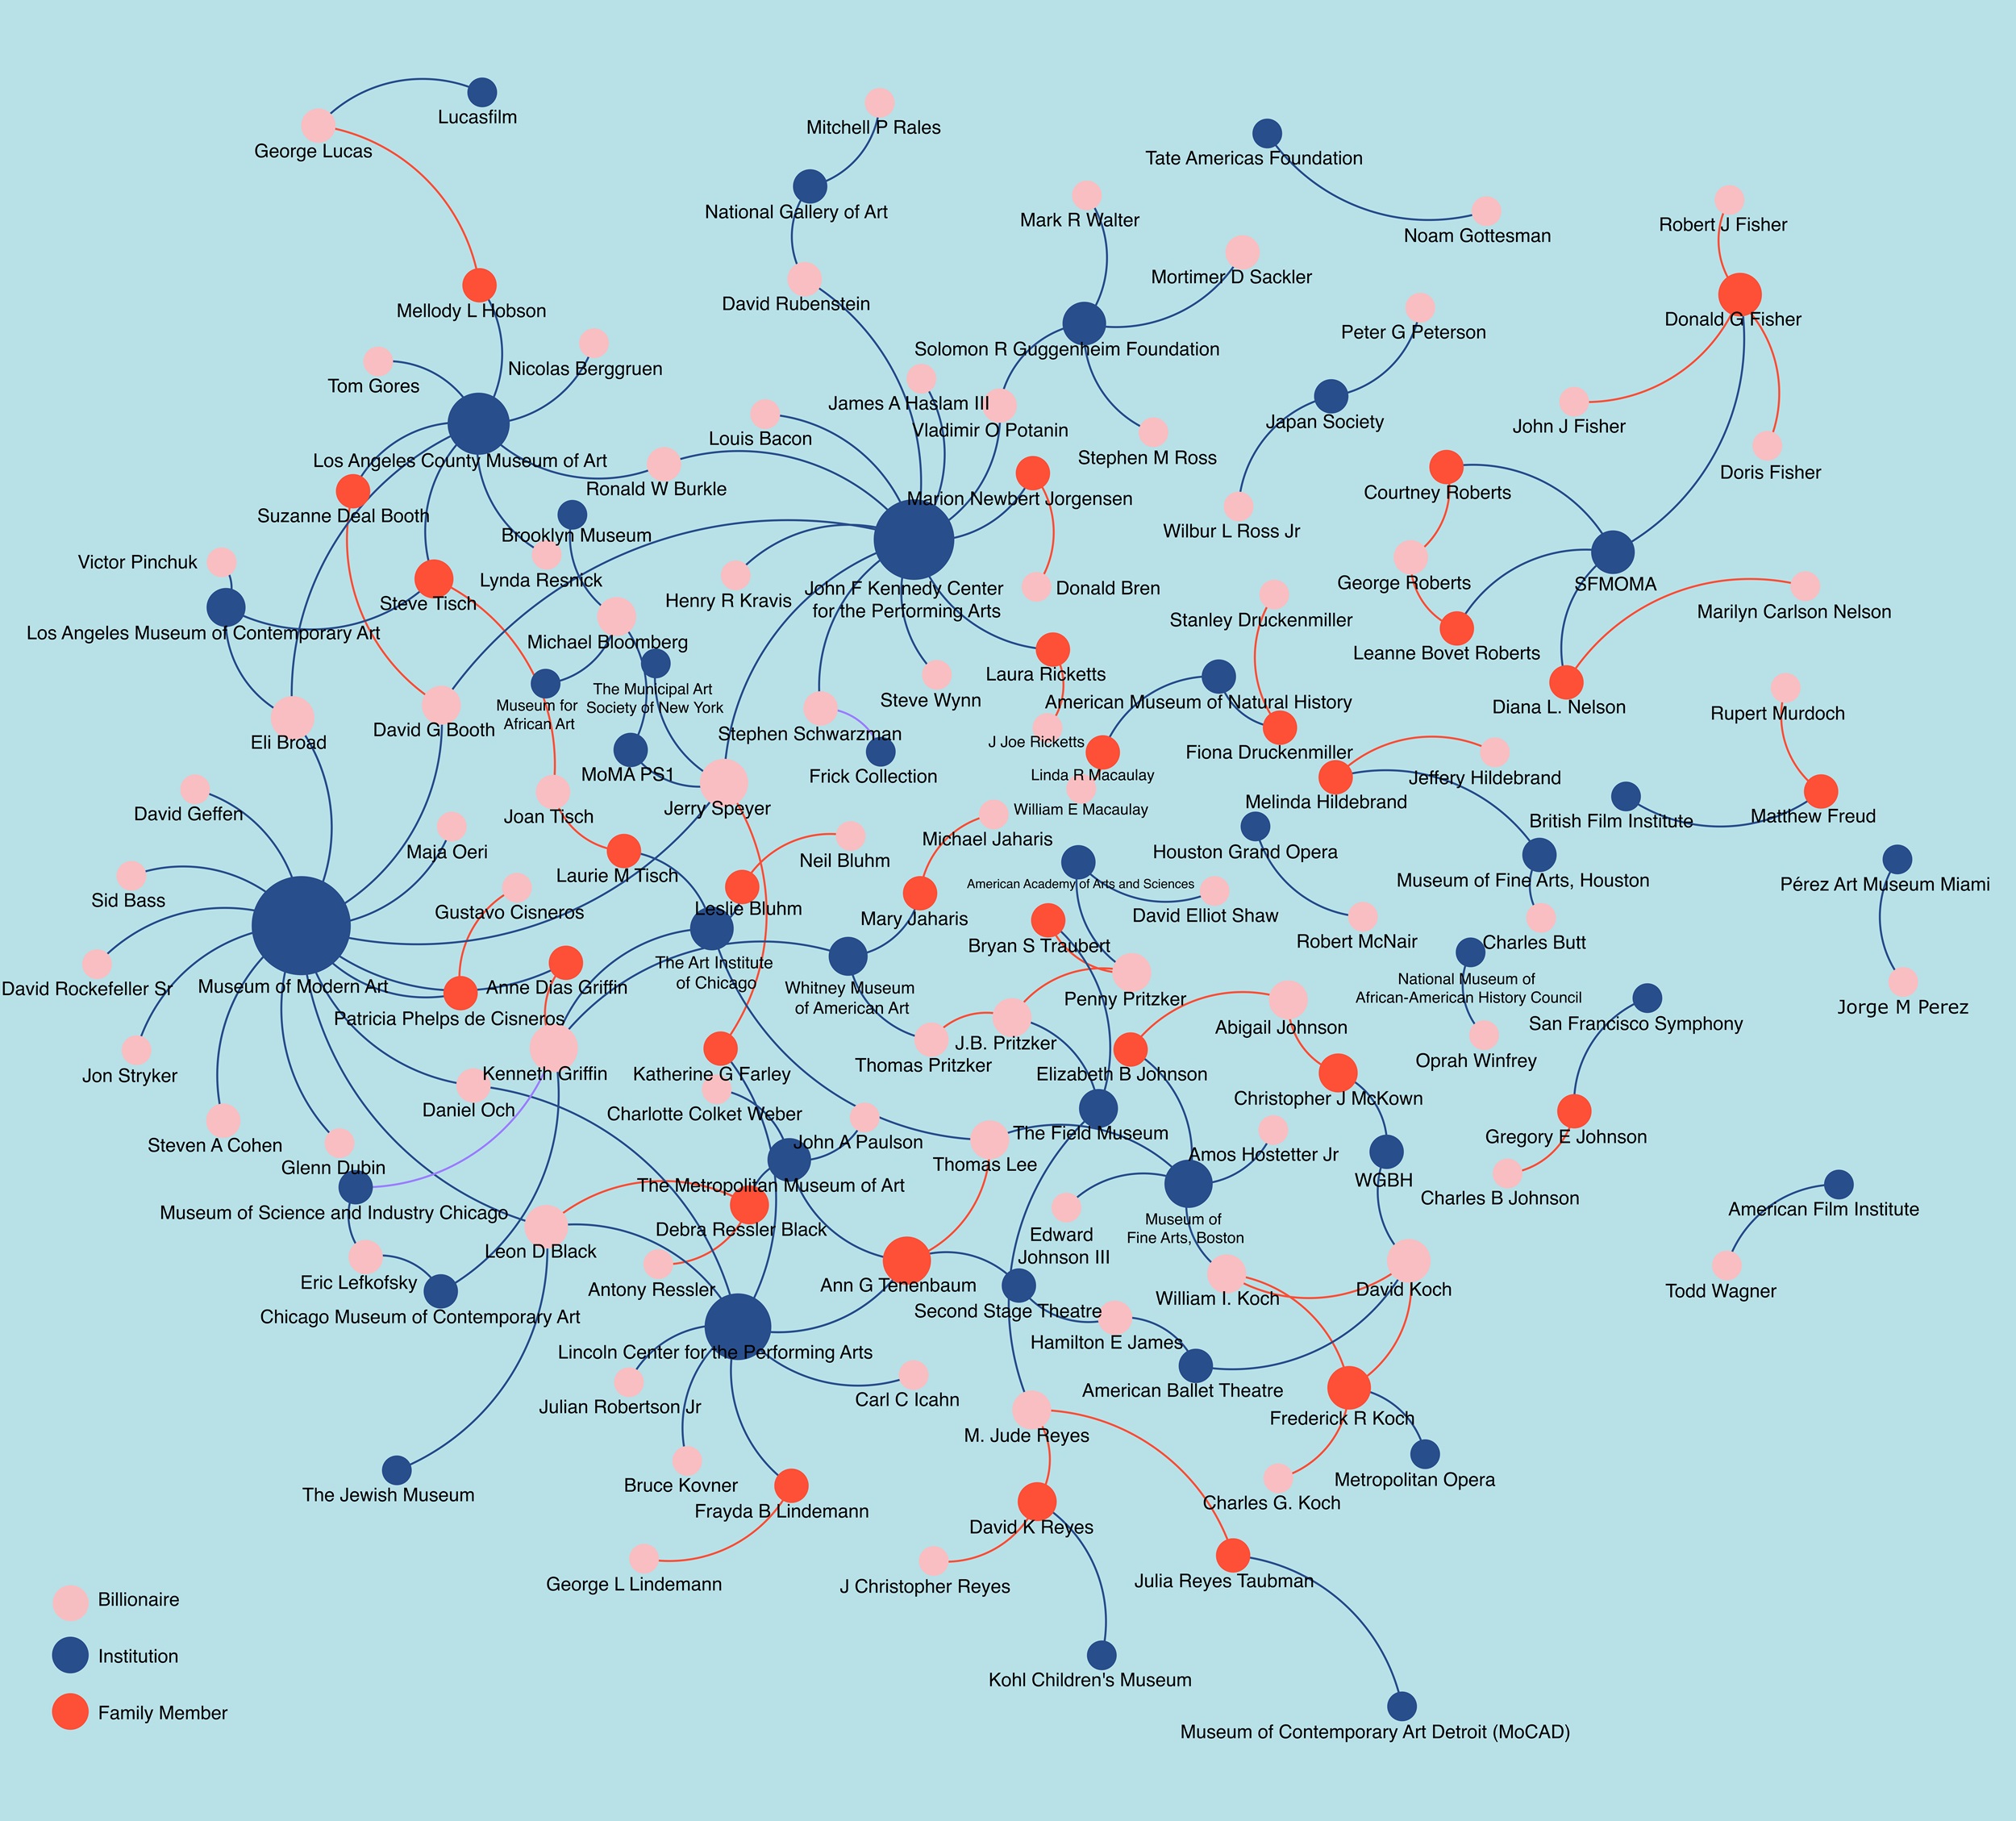
As network scientists, we often seek to bring large datasets to bear on subjects that may not have previously had significant quantitative data available as part of their analytical toolkit.3 We came to the topic of museum funding through another project that used crowdsourced data from the LittleSis database to understand how billionaires and their families were connected to a range of not-for-profits, including arts institutions.4 As figure 1 shows, certain institutions, such as the Museum of Modern Art (MoMA) in New York City and the Kennedy Center in Washington, DC, attract many billionaires, serving as the center of an elite network of wealthy donors, while others, like Pérez Art Museum Miami, are supported by just one billionaire—in this case the billionaire for whom the museum is named. This essay builds on that initial work on studying networks of billionaires and their philanthropic giving by focusing on philanthropic giving to art museums in the United States in particular. In line with Panorama’s focus on American art, we center our attention on the funding of “American art” by using a sample of museums that articulate their support of American art in their mission statements.
Data and Methods
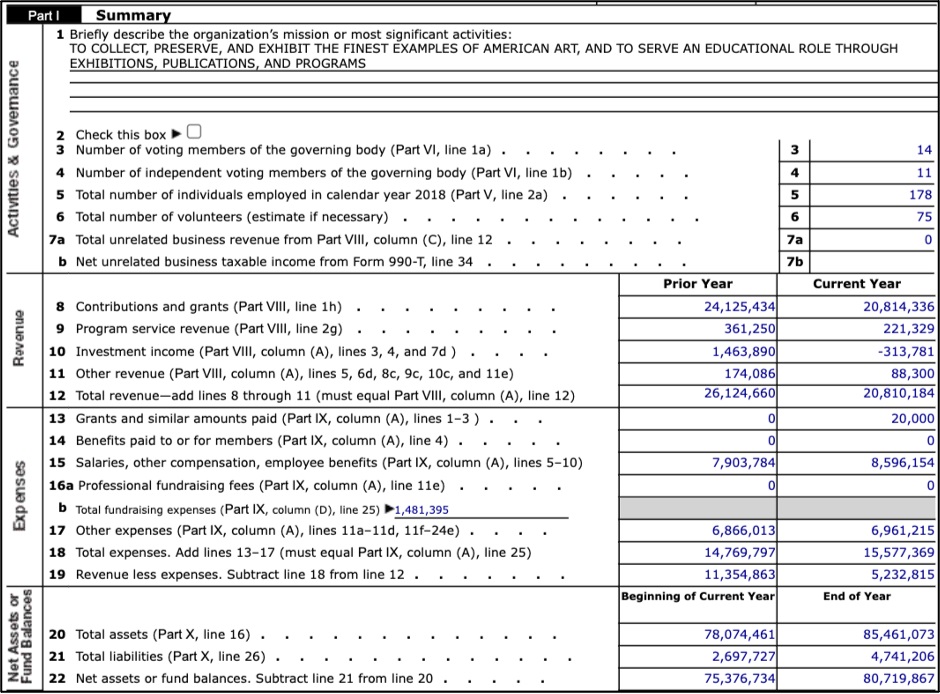
There are two principal sources of publicly available data about museum funding: annual reports published—increasingly online—by museums themselves and the 990 tax form. All 501(c)(3) tax-exempt charitable and nonprofit organizations (except for churches) are required by the United States Internal Revenue Service (IRS) to file a 990. This form contains information on the organization’s name, purpose, location, board members, highest-paid staff members, and layers of financial information related to assets, revenue, and expenses (fig. 2). The goal of the form is, as stated by the IRS, to increase charities’ financial transparency and allow the government to ensure that the work of the charity aligns with what is needed for tax-exempt status.5 The 990 forms are publicly accessible once they are processed, although there is a lag between the end of a charity’s fiscal year, their tax filing, and the public release of that filing by the IRS.6 For organizations like foundations that grant money to other organizations, the form requires a listing of the recipient’s name and address, as well as the amount of the grant and a stated purpose.
Our initial data collection and processing was linked to prior work that we completed to analyze philanthropic grants to science. We collected 3,910,398 tax forms for 685,397 organizations, with 3,660,949 filings covering years 2010 to 2019.7 Initially, we focused on the more than ten million grants given and disclosed on charities’ tax forms. Those filing IRS form 990 represented 3,678,608 grants (35 percent) and had to list the recipient’s Employer ID Number (EIN), uniquely identifying the grant recipient. The remaining 6,710,171 grants came from returns of private foundations that filed form 990PF; this requires only the name and address of the recipient but not a unique identifier. However, we were often able to use the IRS business master files (BMF) to match organizations by name and state of incorporation to obtain their EIN.8
For studying art museums, we focused on two specific sections of these tax forms. The first is related to grants and donations received—often for a stated, if somewhat generally described, activity. The second is the required list of board members and other individuals involved in institutional governance. Focusing on these two pieces of information, we gathered tax data for about 146 institutions that are certified by the Association of Art Museum Directors (AAMD). We focused on 146 institutions out of a total of 227 because the remaining eighty-one members are university museums, whose financials cannot easily be separated from those of their larger host institutions.
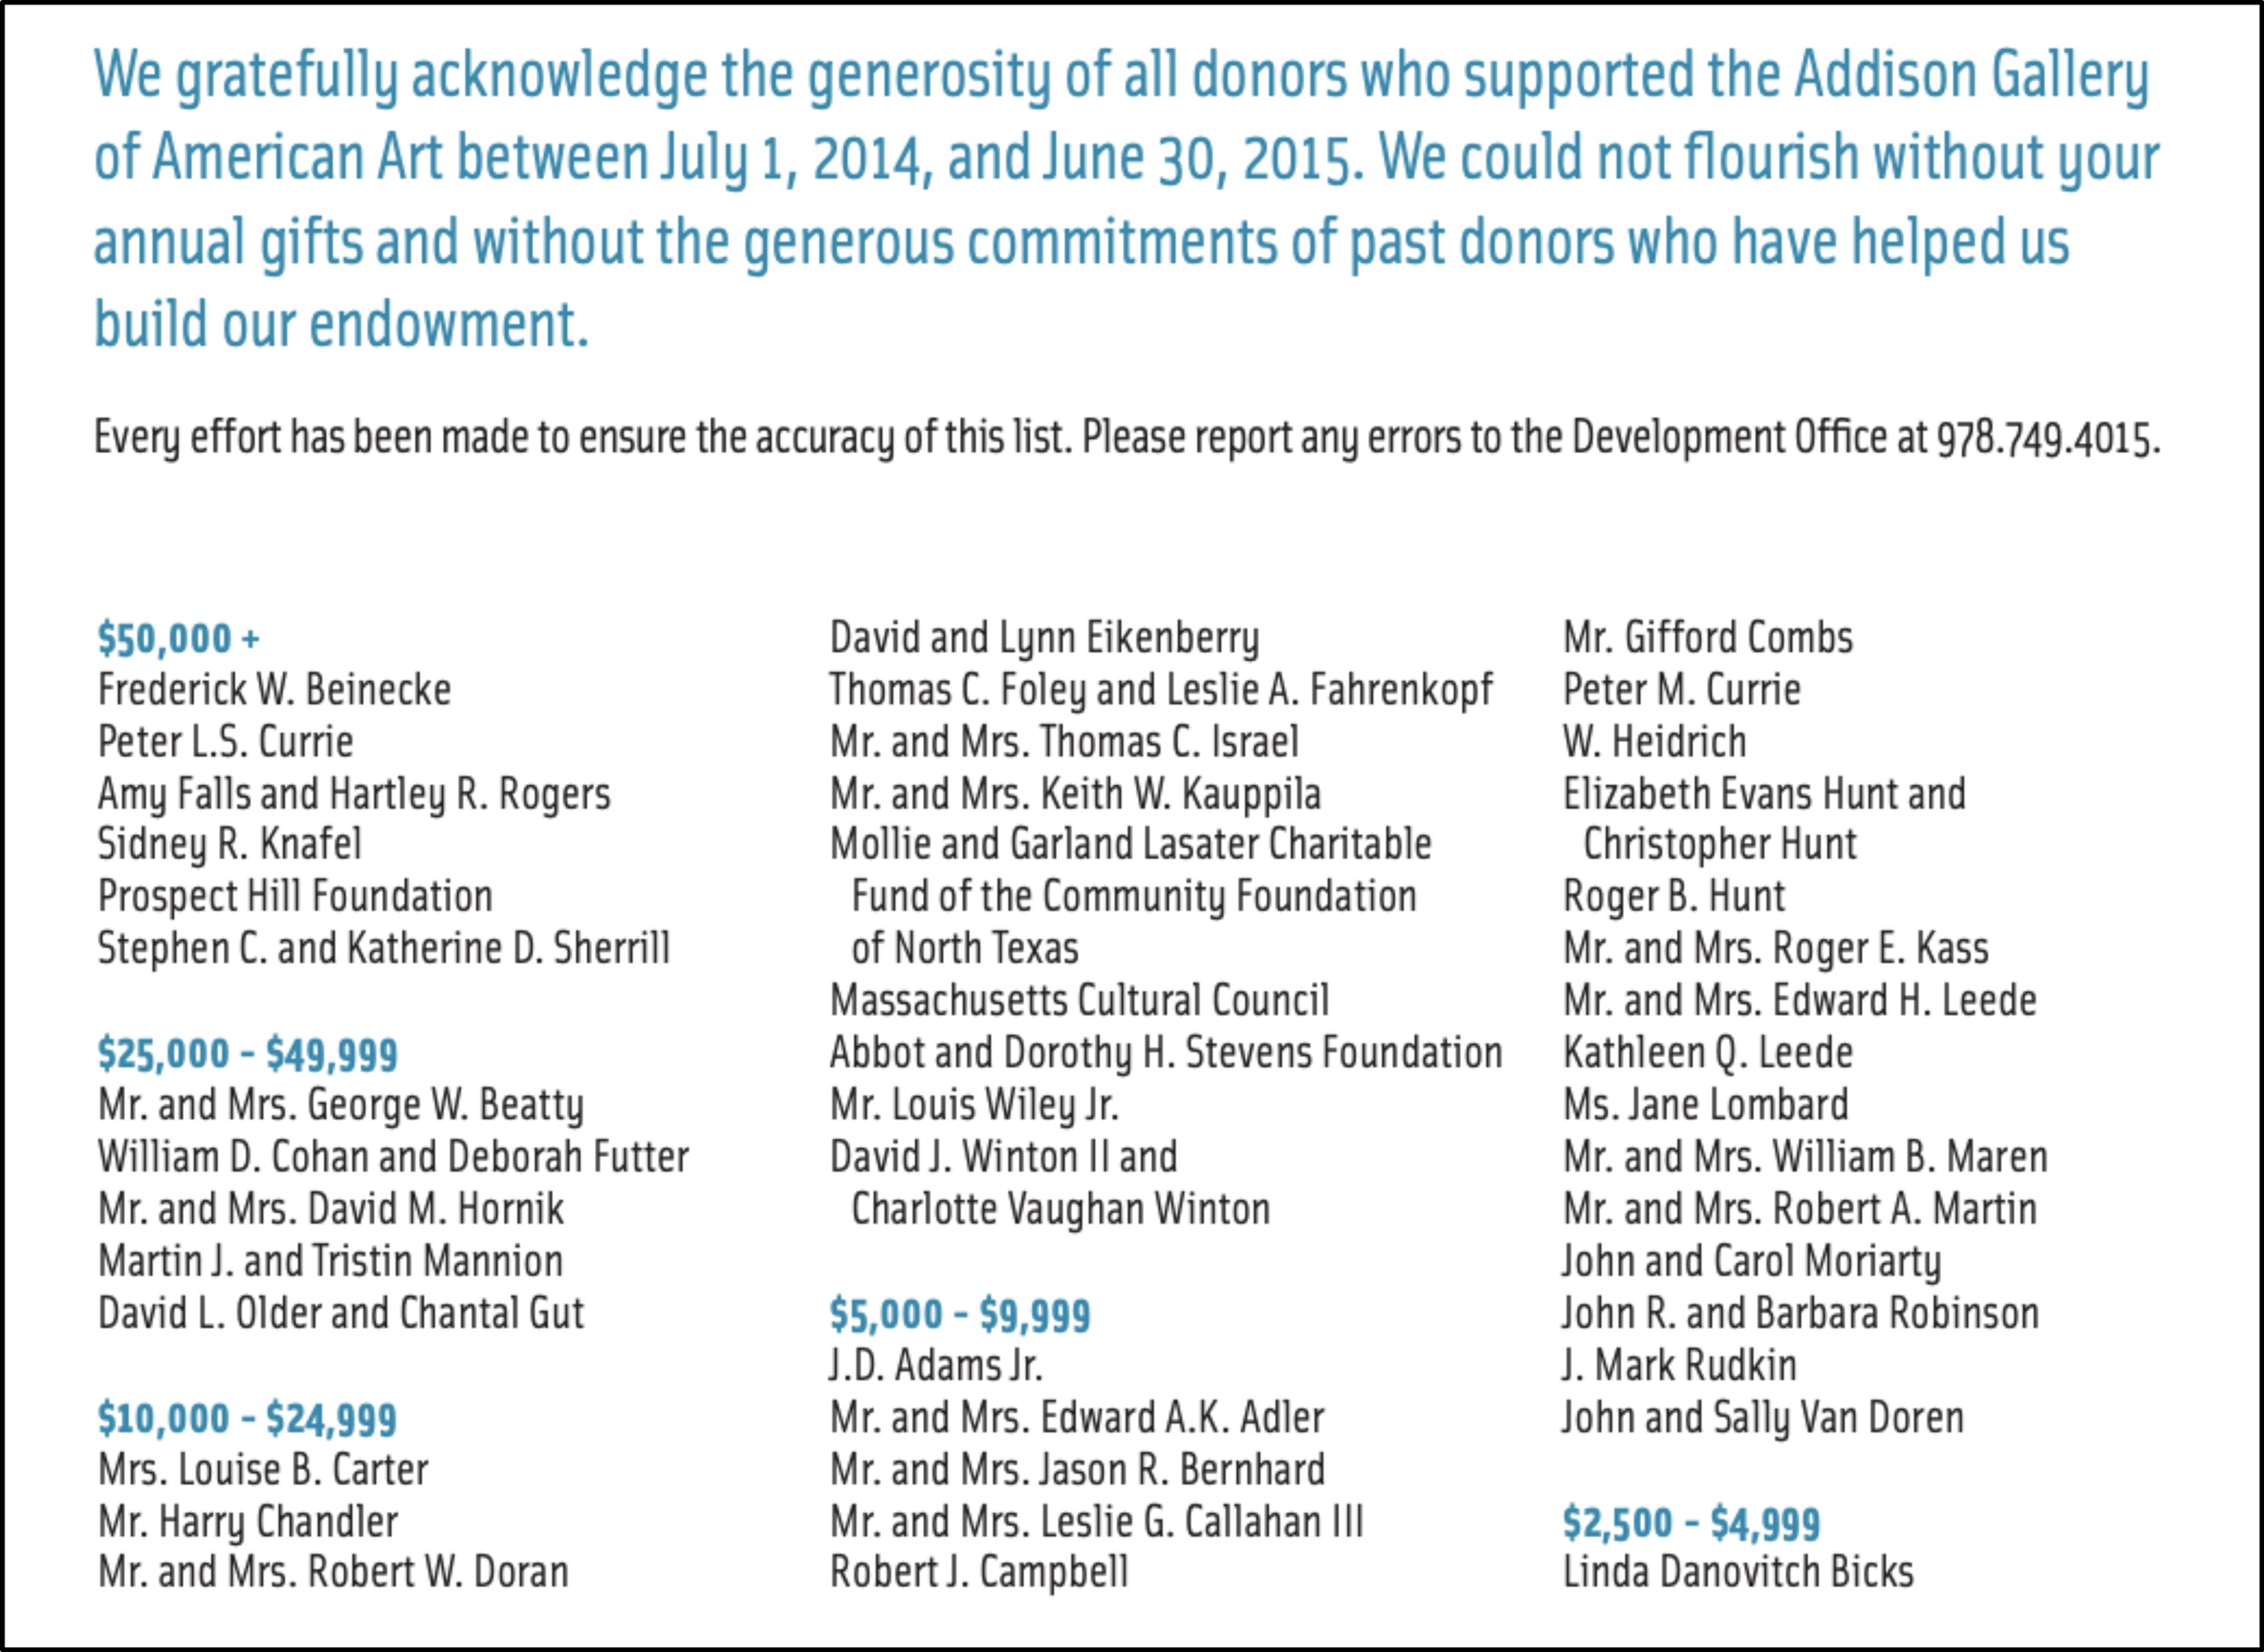
Of the 146 total institutions across all years, we obtained 2019 tax filings for 127 AAMD member institutions, who collectively received $3.8 billion in contributions in that year.9 The largest of these was the Smithsonian Institution, which received $1.3 billion; the Metropolitan Museum of Art received $343 million; MoMA received $244 million; the National Gallery of Art received $181 million; and the Art Institute of Chicago received $98 million. The median AAMD member in our dataset received $8.3 million in contributions.10 For this project, we also supplemented information available on the tax forms by web-scraping museums’ annual reports. From these reports, we extracted data from the list of donors typically provided at the end of the report (e.g., fig. 3). In the annual reports, there are often ranges of donations reported, such as $1,000–$5,000, which precludes us from knowing the exact amount the individual donated. In these cases, we assigned the individual as having donated at the midpoint of the reported range, which may over- or underestimate the amount the individual gave.
While some of these donations inevitably went to fund projects related to American art, it is difficult to identify these initiatives in larger museums that engage with art from a wider range of geographic areas. Some detail about specific projects is available on the 990s, but this is not systematic and demands a careful parsing of text and other descriptive information available about each institution. Therefore, we chose to further narrow our sample for this initial study by focusing on a subset of museums that specifically note the support and study of American art in their mission statements.
A Focus on Funding for Museums of American Art
In table 1, we identify seventeen institutions that have a stated focus on American art. However, two of these—the Smithsonian American Art Museum and the Addison Gallery of American Art—are part of larger institutions, the Smithsonian Institution and Phillips Andover Academy, respectively. It was difficult, therefore, to isolate information about their funding. According to their 990s, the remaining fifteen institutions received a total of $190 million in donations in 2019. Crystal Bridges received $71 million, and the Whitney brought in $56 million, but the median institution in this group received just $3.2 million in donations.11
|
|
Donors from Annual Report (Year) |
Foundation Donors |
Board Members |
|
Addison Gallery of American Art |
X (2015) |
* |
* |
|
American Folk Art Museum‡ |
X (2018) |
X |
X |
|
Amon Carter Museum of American Art |
X (2020) |
X |
X |
|
Brandywine River Museum of Art |
X (2020) |
X |
X |
|
Butler Institute of American Art |
|
X |
X |
|
Crystal Bridges Museum of American Art |
X (2022) |
X |
X |
|
Farnsworth Art Museum |
X (2018) |
X |
X |
|
Long Island Museum of American Art |
– |
X |
X |
|
Museum of Latin American Art |
X (2019) |
X |
X |
|
New Britain Museum of American Art |
X (2022) |
X |
X |
|
Ogunquit Museum of American Art |
– |
X |
X |
|
Pennsylvania Academy of the Fine Arts |
X (2018) |
X |
X |
|
Reynolda House Museum of American Art |
– |
X |
X |
|
Smithsonian American Art Museum |
† (2020) |
* |
* |
|
Westmoreland Museum of American Art |
X (2021) |
X |
X |
|
Whitney Museum of American Art |
X (2021) |
X |
X |
|
Winterthur Museum, Garden & Library |
X (2021) |
X |
X |
Table 1. American art institutions and the data sources collected for them. Cells that have an X show where data was successfully collected. The first data source is the institution’s annual report, which often contains a list of donors who supported the institution in that year; we include in parentheses the year of the annual report. Our second data source is IRS 990 forms filed by foundations and other donors; we processed these forms and identified funders listed as supporting the institution. Last, we extracted the list of board members from the institution’s own 990 form. We could not find a publicly available annual report for the Long Island Museum of American Art, the Ogunquit Museum of American Art, and Reynolda House Museum of American Art.
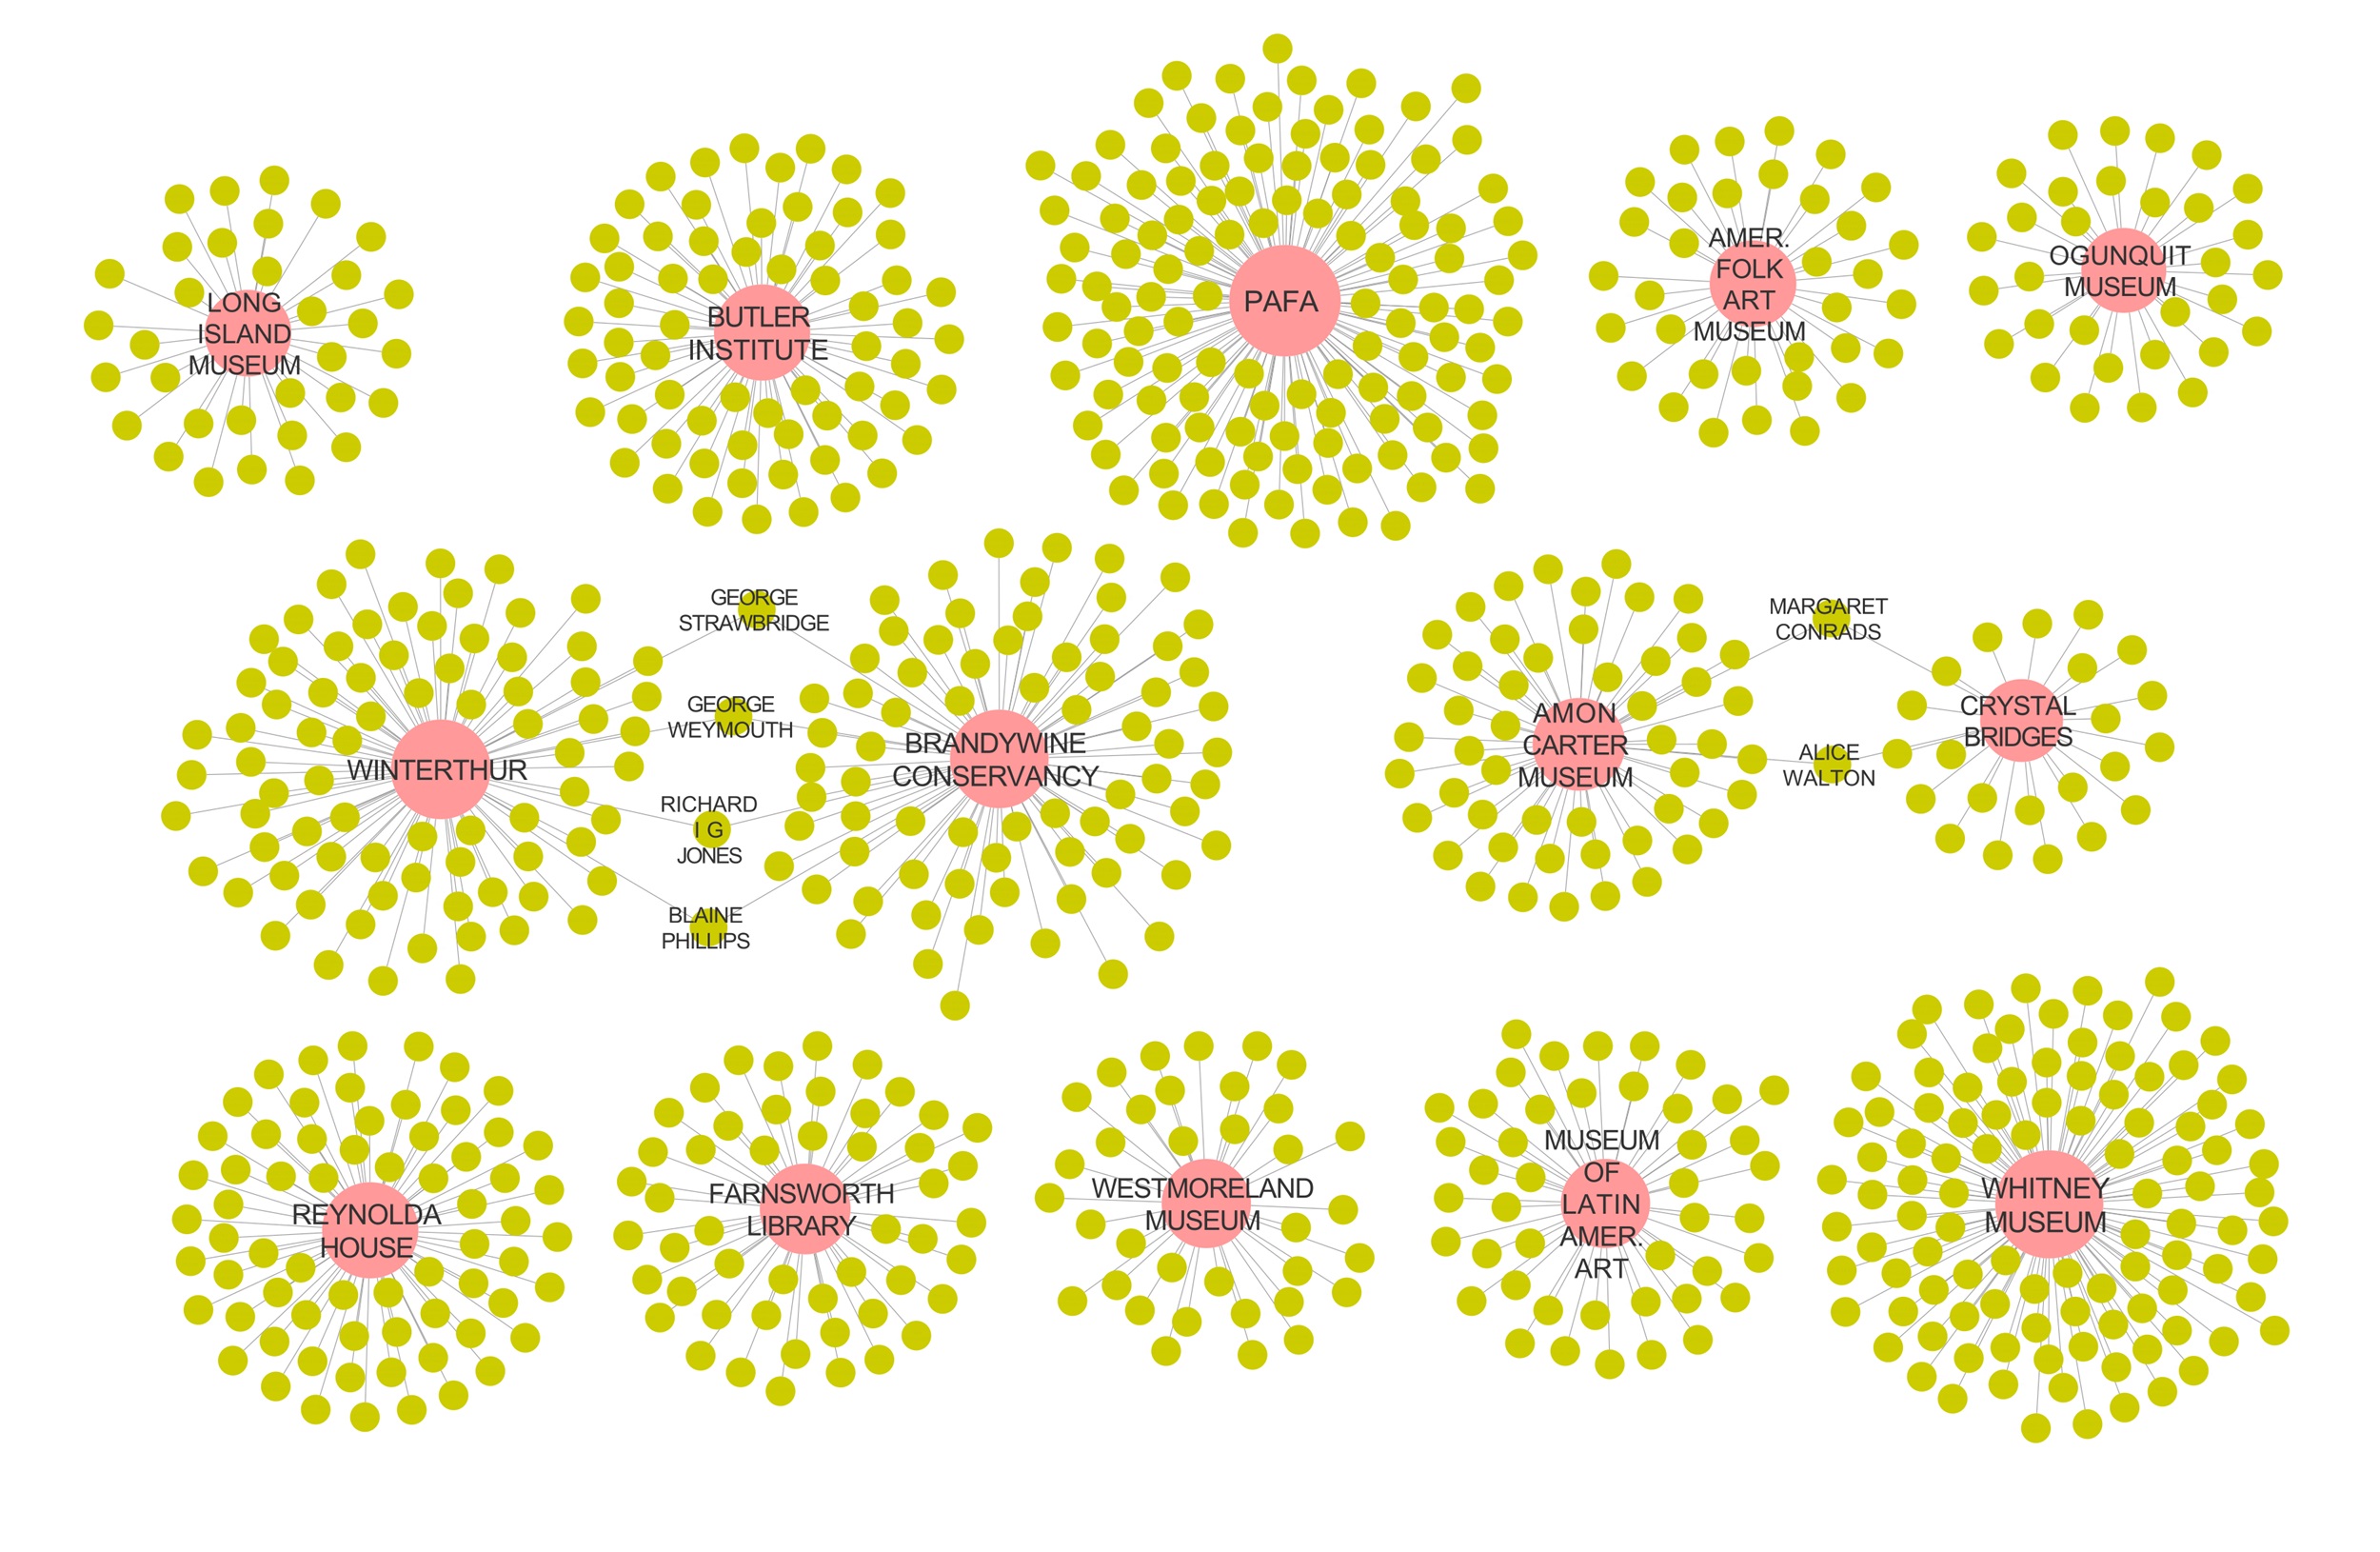
Using information on the annual reports and 990s, we examined the boards of trustees and funders for fourteen of these institutions. Interestingly, the overlap between board members of institutions is minimal, as shown by the largely isolated flowerlike patterns in figure 4. Trustees are on the board of only one American art institution at a time. This could be related to the significant time commitments of serving on boards. Also, trustees are asked to both donate to a museum and solicit gifts from other potential donors. Serving on the boards of two similar institutions can create conflicts of interest. This also reinforces the findings in figure 1. Consider one of the only billionaires who served simultaneously on several different boards of arts institutions, Leon Black, whose trusteeship has since become controversial.12 He is on the board of MoMA, the Museum of Contemporary Art (MoCA) in Chicago, the Jewish Museum in New York, and Lincoln Center. All of these institutions have unique and distinct focuses. In the case of possible conflict—like between MoMA and MoCA Chicago—the fact that the museums are in different cities helps ameliorate the situation. The fact that Black, who lives in New York City, serves on a Chicago board is exceptional. We find that board members are often local: trustees usually live within the same state or metropolitan area that they serve. This would suggest that even in a globalized world and for museums with a national profile, there is still a home bias where trustees want to support a cultural resource in their own local geographic area.
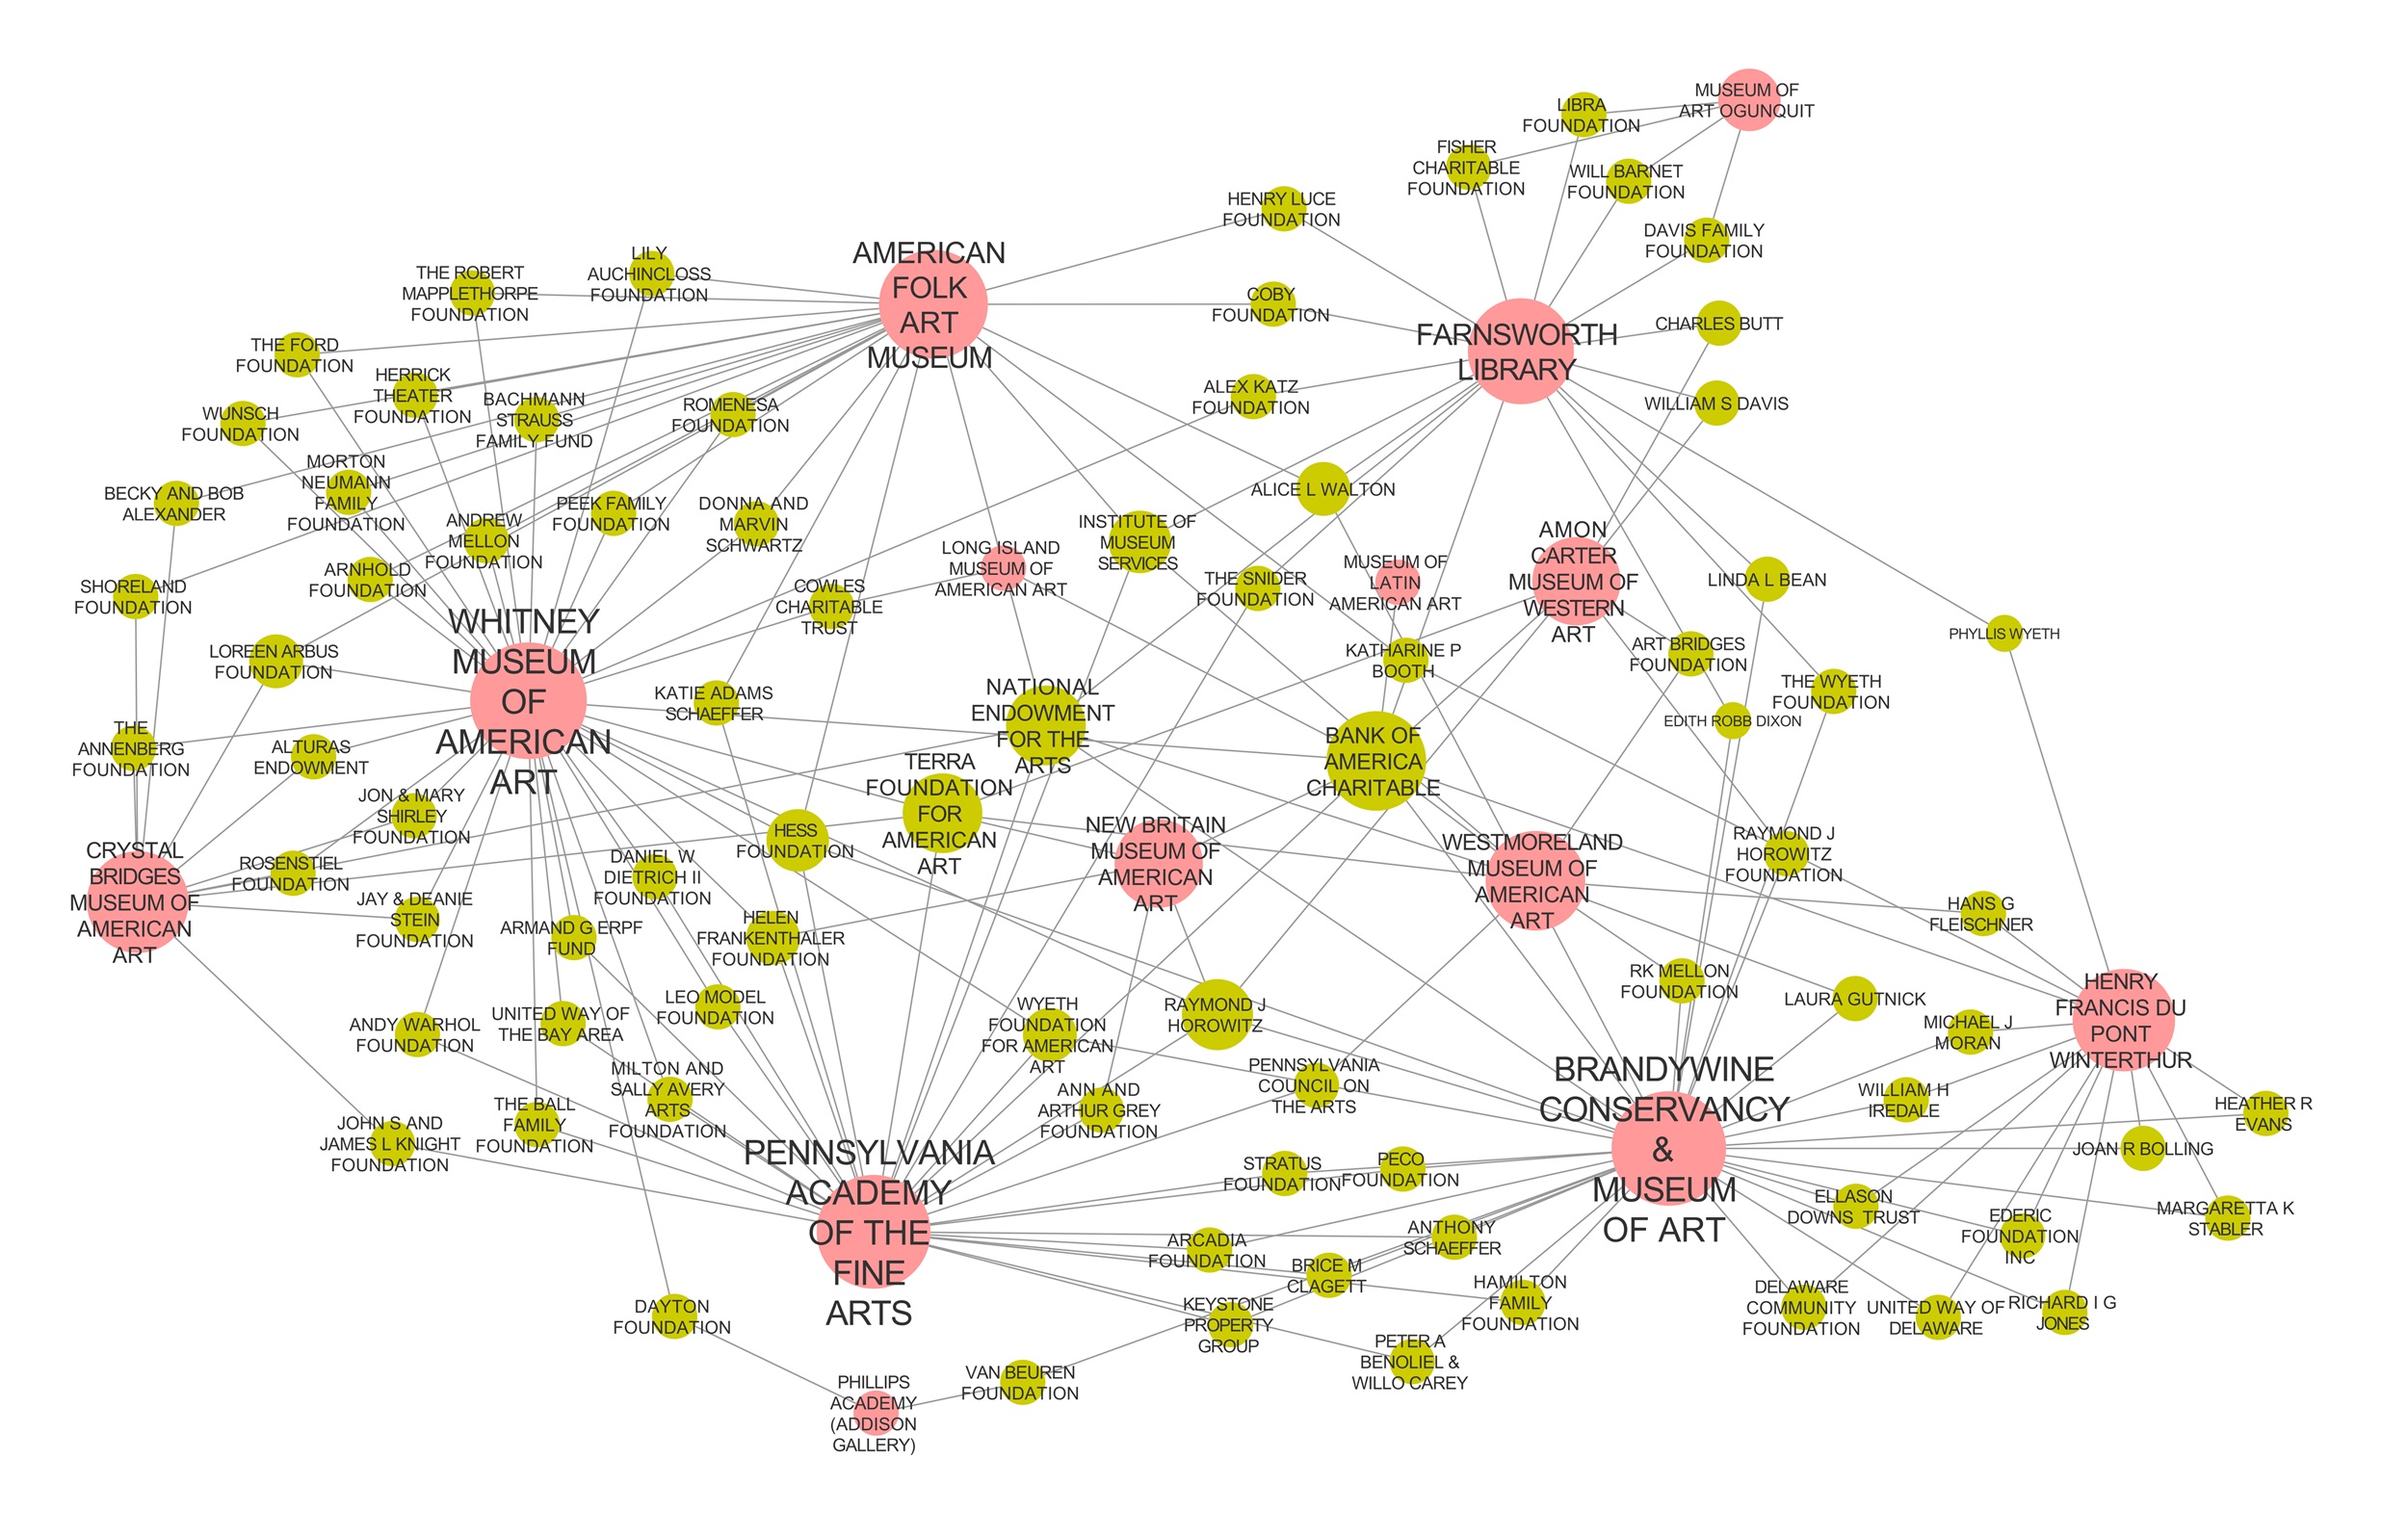
In contrast, as shown in figure 5, many museums with a focus on American art share donors, if not trustees—particularly institutional donors. This suggests that there are donors with a declared focus on American art—like the Terra Foundation and the Wyeth Foundation—that fund projects across a range of institutions with this geographic focus. While these institutions share donors, however, the quantity of money donated is radically different from one institution to the next. This sample of American art museums received $110 million of contributions from foundations in 2019. A preponderance of that money went to just a handful of museums: $50.6 million went to the Whitney (representing a majority of its $56 million in contributions from all sources in 2019, with much of that coming from a reported $35 million donation from the Roy Lichtenstein Foundation), and $21.6 million went to Crystal Bridges. (The Smithsonian Institution received $31.6 million from foundations, but presumably only a subset goes to Smithsonian museums focusing on American art.) Thus, aside from these three institutions, there remains only $6.6 million given to the remaining thirteen American art museums. This suggests that larger institutions—which presumably have more staff members dedicated to advancement and larger operating budgets—attract more and larger donations. This could be to support more ambitious exhibition projects that are impossible for smaller institutions to mount. Importantly, it seems that foundation giving is generally not redistributive but rather gravitates toward large, already comparatively well-resourced institutions with national profiles.
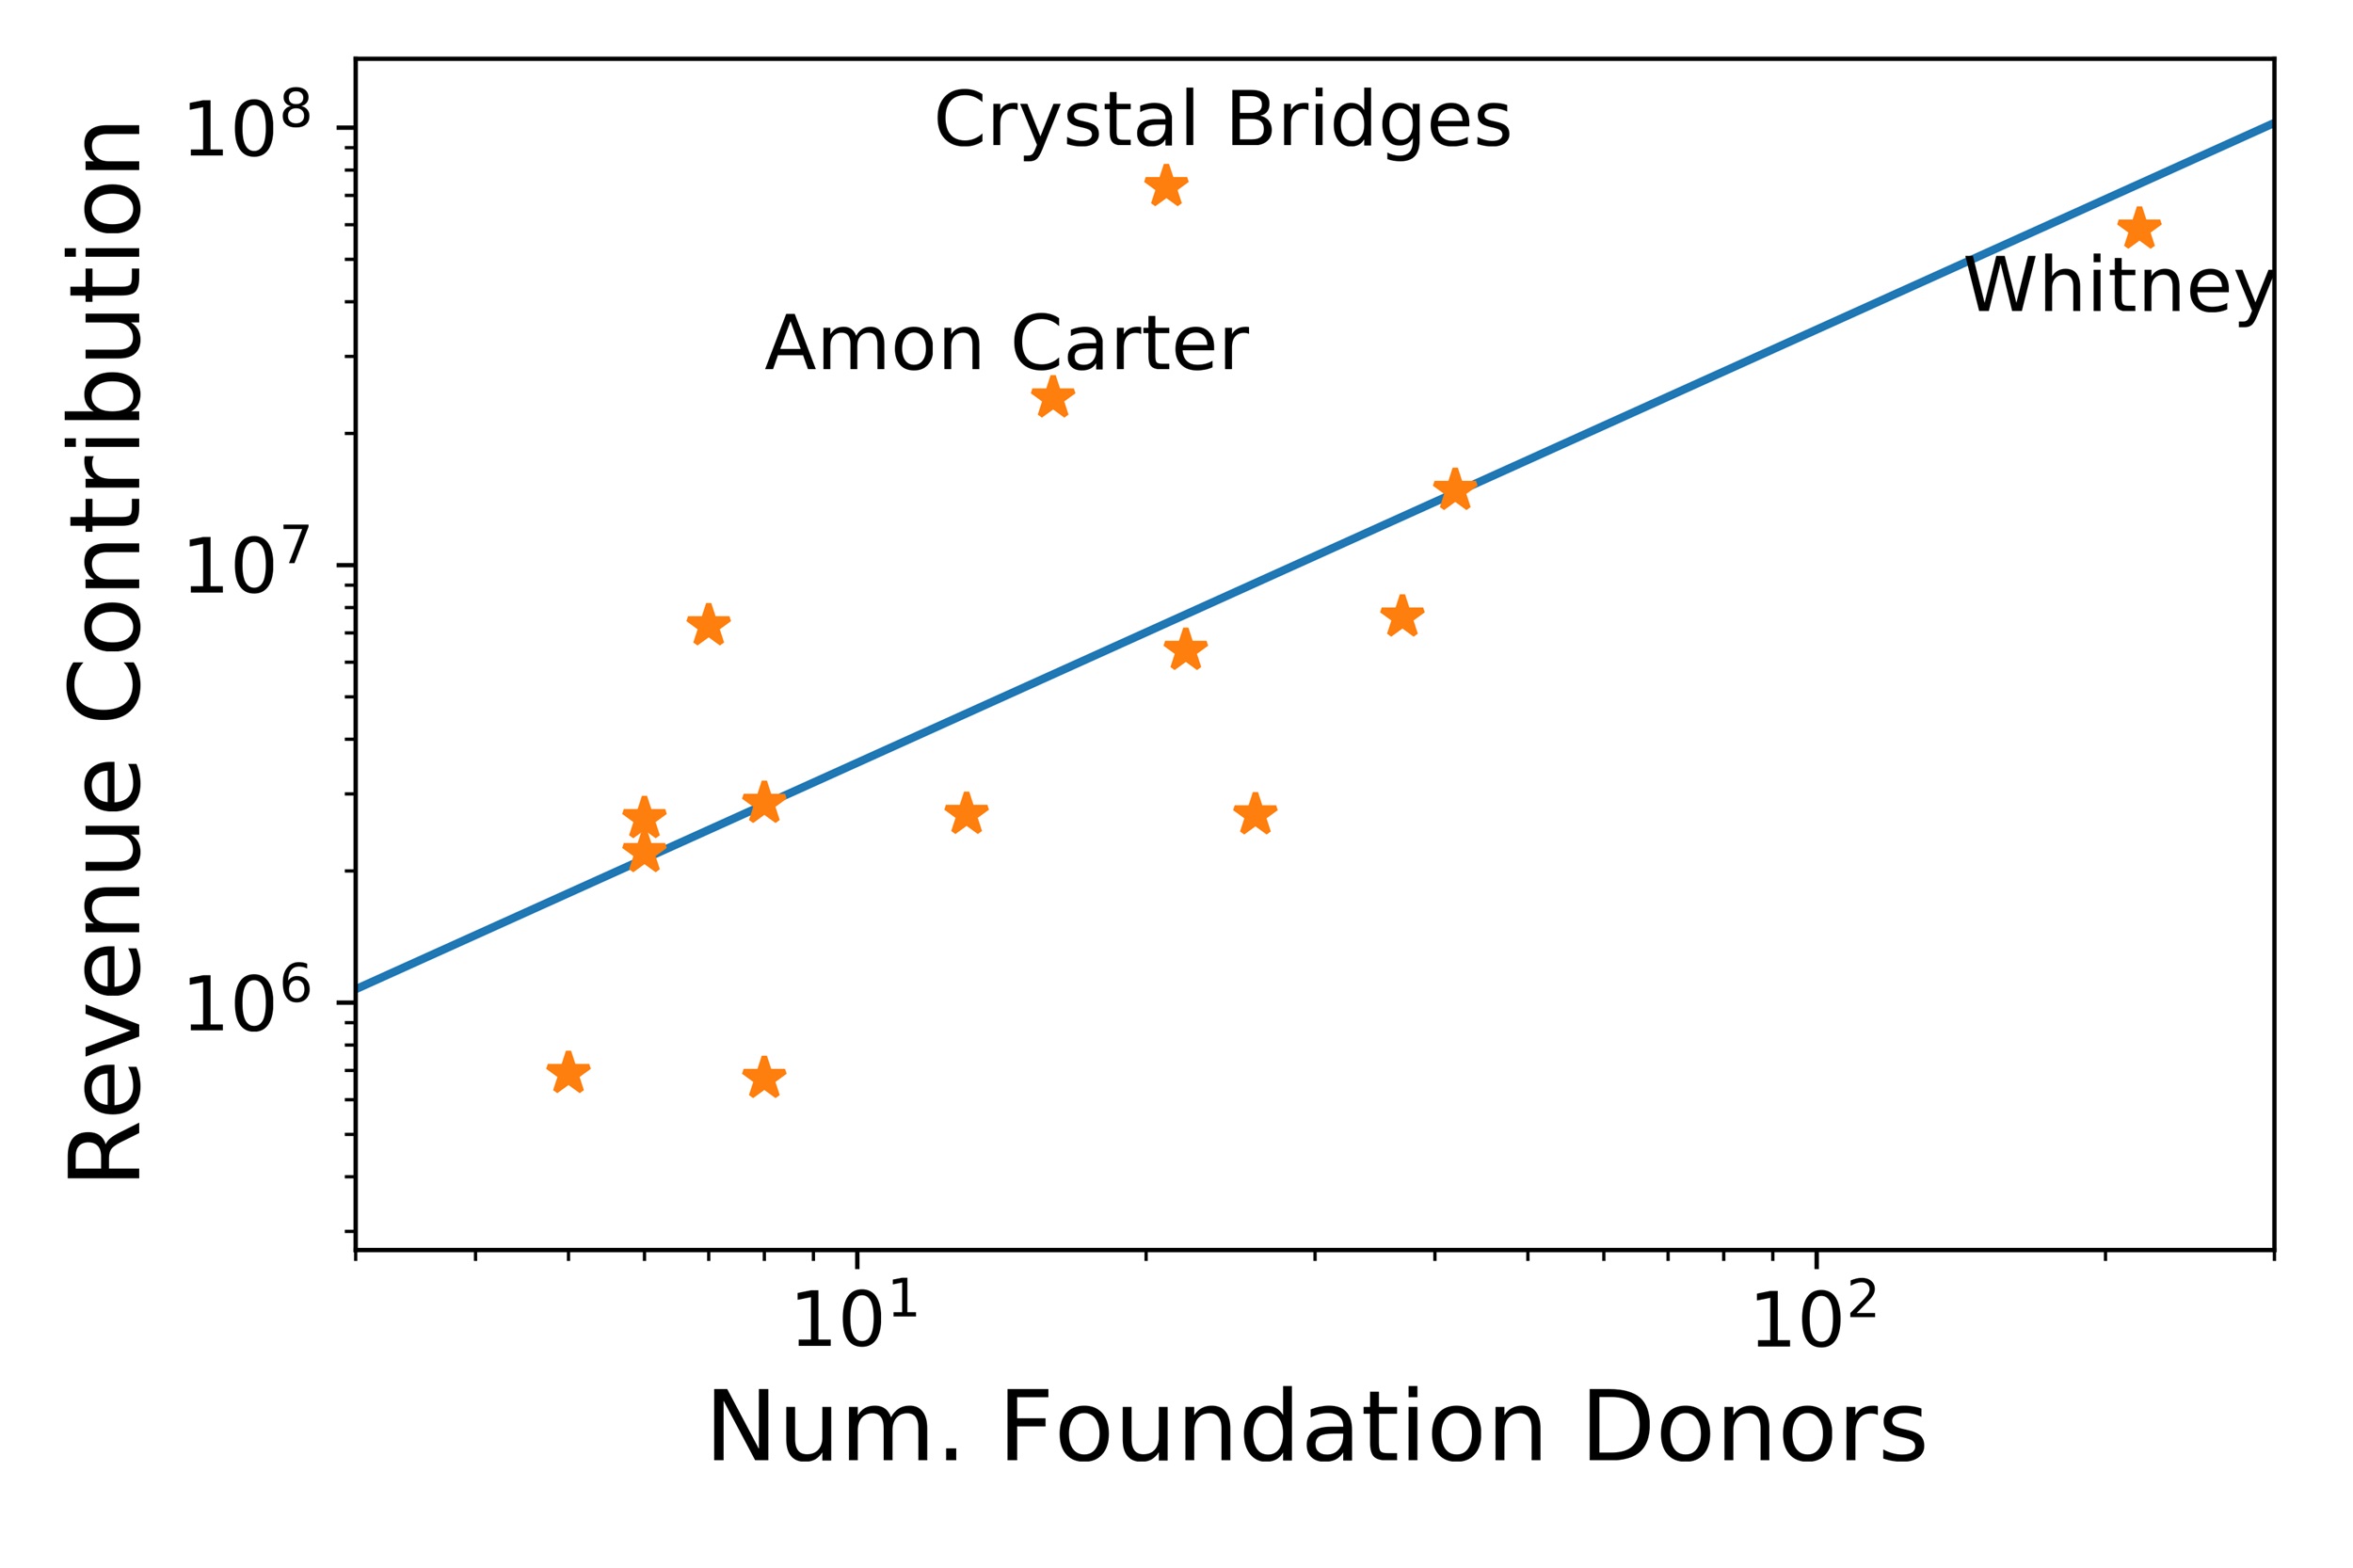
This bias toward larger institutions carries over to the number of foundation donors as well; as we can see in figure 6, the number of institutional donors to the Whitney dwarfs the other institutions. The remaining institutions have a more similar, limited number of institutional donors (fig. 7). To understand how foundation support relates to the overall support from contributions, we compared the number of foundation donors versus the total amount listed as received in contributions on the 990 form in 2019. In figure 8 we see that the total amount in contributions correlates highly with the number of foundation donors (the Spearman Rank Correlation is statistically significant with a value of 0.69, p = 0.007). At the same time, a couple of exceptions are Crystal Bridges and the Amon Carter Museum of American Art in Fort Worth, which received considerably more revenue in contributions (potentially both from Alice Walton) than would be expected based on the number of foundations that supported them.
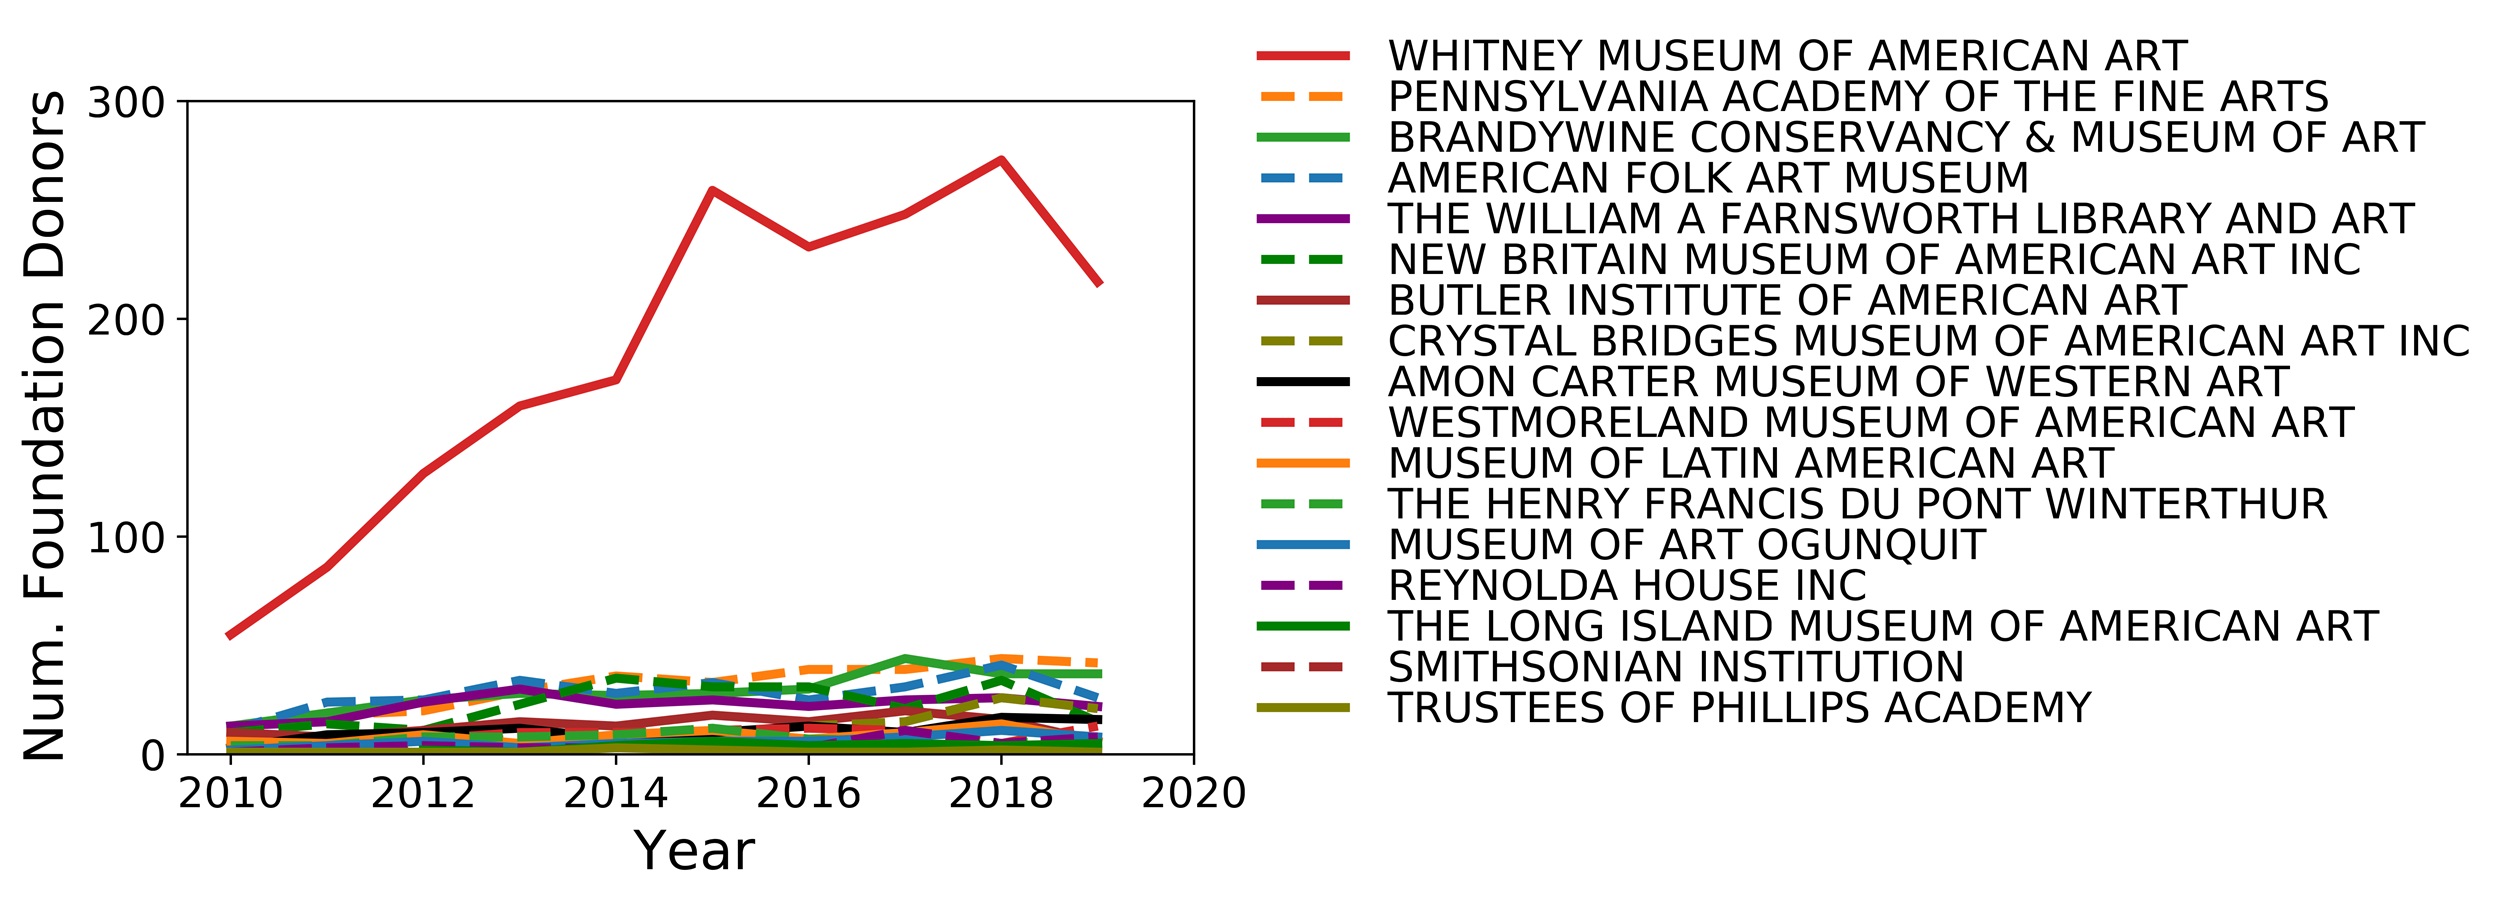
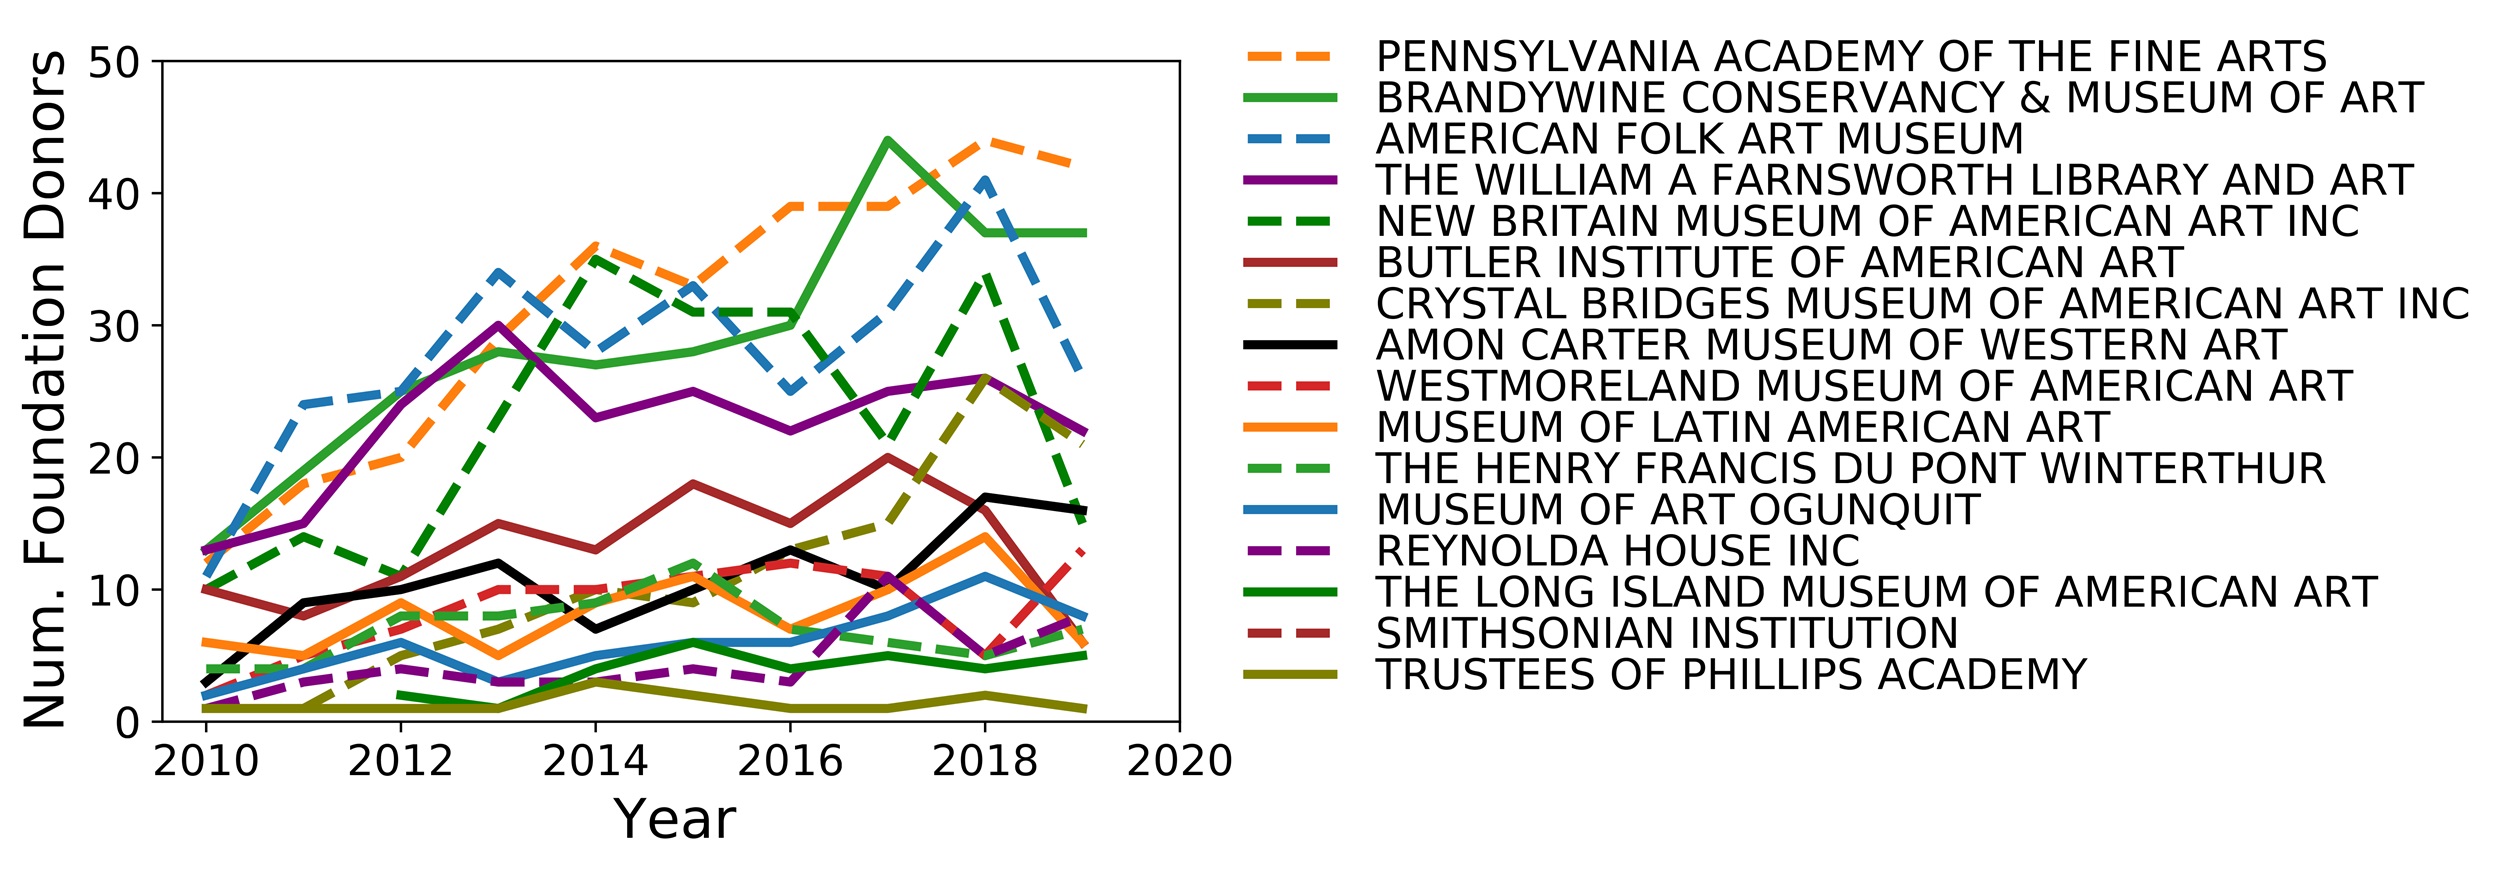
Figs. 6, 7. The number of foundation donors to selected institutions over time. The Whitney Museum of American Art and the American Folk Art Museum had considerably more foundation donors than any of the other institutions involved with American art. The increasing trendline from 2010 to 2015 is exaggerated by the fact that more foundations started filing their 990 forms online during this period, allowing us to track their grants.
As with trustee membership, foundation giving—apart from that by large, nationally active institutional donors like the Ford Foundation—also tends to have a local bias. We examined each foundation that gave to an American art institution in our set and checked whether the foundation’s state of incorporation was the same as that of the institution. We found that 55 percent of grants to American art institutions are from local foundations and that these foundations make up 63 percent of the total foundation dollars. Notably, many institutions have even higher rates of local support, with some, such as the Reynolda House Museum of American Art in Winston-Salem, receiving more than 90 percent of their foundation support from local foundations. Like individuals, foundations often seem to support institutions within their geographic orbit.
Frustratingly, while the 990s create some transparency about the number and size of donations to art museums, and where those funds come from, it is difficult to match these donations to specific initiatives. The 990 demands only limited descriptions about how funds are used. This results in language like “to support educational operations,” “arts and culture,” and “general support,” although some institutions voluntarily provide more helpful descriptions, such as of a $2.25 million grant from the Mellon Foundation to the Denver Art Museum “to establish an endowment in support of the museum’s curator of Native arts position, and to support a curatorial fellowship in Native American art.” In general, though, using these declarations to puzzle out what money specifically went to support what can be challenging; it requires matching flows of money to a museum’s reported activities, such as a list of sponsors for an exhibition or a publication celebrated in an annual report. One next step that will be valuable but labor-intensive is to do this matching for institutions for which detailed and digitized annual reports and 990s exist.
Conclusion
While it can be important to understand the individual profiles of notable donors and trustees, this article is a first step toward using available digitized tax returns and annual reports to seek to move the discussion beyond these specific profiles and instead focus on a more systematic investigation of the funding stream for American art museums. Future research questions include: What is the balance between individual and institutional support? How does the fact that people tend to give locally reinforce disparities between institutions, referring to the fact that rich museums in rich cities get more money? What is the role of government support, if any, for most museums? The datasets presented here can begin to address those questions through partnerships between data scientists with methods like ours and art historians—like those featured in this special section—with field-specific knowledge. We hope to provide the data and some quantitative analytical skills to support those collaborations.
November 24, 2023: The spelling of Daria Koshkina’s name was corrected.
Cite this article: Albert-László Barabási and Louis Shekhtman, “Who Supports American Art Museums? Introducing a New Dataset and Data Sources about Museum Funding,” in “Reflecting on ‘Toward a More Inclusive Digital Art History,’” special section, ed. Diana S. Greenwald, Panorama: Journal of the Association of Historians of American Art 9, no. 2 (Fall 2023), https://doi.org/10.24926/24716839.18343.
Notes
We thank Daria Koshkina and Alice Grishchenko for assistance with visualizations, and Samar Dikshit and Yixuan Liu for help with the previous Billionaire Project data collection. We also held useful discussions with András Szántó, Adam Levine, and Brent Reidy.
- Robin Pogrebin, Elizabeth A. Harris, and Graham Bowley, “New Scrutiny of Museum Boards Takes Aim at World of Wealth and Status,” New York Times, October 2, 2019, www.nytimes.com/2019/10/02/arts/design/whitney-art-museums-trustees.html; Robin Pogrebin and Elizabeth A. Harris, “Warren Kanders Quits Whitney Board after Tear Gas Protests,” New York Times, July 25, 2019, www.nytimes.com/2019/07/25/arts/whitney-warren-kanders-resigns.html; Robin Pogrebin, “Julie Mehretu Becomes Third Artist Ever to Join Whitney Board,” New York Times, October 12, 2021, https://shorturl.at/hu168. ↵
- Annette Zimmer and Stefan Toepler, “The Subsidized Muse: Government and the Arts in Western Europe and the United States,” Journal of Cultural Economics 23, no. 1 (1999): 33–49; David Yermack, “Donor Governance and Financial Management in Prominent US Art Museums,” Journal of Cultural Economics 41, no. 3 (2017): 215–35; Lorraine A. Stuart, Thomas F. R. Clareson, and Joyce Ray, eds., Economic Considerations for Libraries, Archives and Museums (London: Routledge, 2021); Meredith Ingersoll Loy, “Sell the Warhol, Save the World: Deaccessioning Freedoms and Ethical Funding Solutions for Art Museums in the United States,” UMKC Law Review 90 (2021): 457; Bruno S. Frey and Stephan Meier, “The Economics of Museums,” in Handbook of the Economics of Art and Culture, ed. Victor A. Ginsburgh and David Throsby (Amsterdam: North-Holland, 2006), 1:1017–47; Nizan Shaked, Museums and Wealth: The Politics of Contemporary Art Collections (London: Bloomsbury, 2022). ↵
- Albert-László Barabási with Márton Pósfai, Network Science (Cambridge: Cambridge University Press, 2016). ↵
- For an introduction to this topic of trustees and boards, see Francie Ostrower, Trustees of Culture: Power, Wealth, and Status on Elite Arts Boards (Chicago: University of Chicago Press, 2020). For our work on this topic, see Louis Michael Shekhtman, Alexander J. Gates, and Albert-László Barabási, “Mapping Philanthropic Support of Science,” arXiv:2206.10661 (2022), https://doi.org/10.48550/arXiv.2206.10661; Louis Michael Shekhtman and Albert-László Barabási, “Philanthropy in Art: Locality, Donor Retention, and Prestige,” Scientific Reports 13, no. 1 (2023): 12157. ↵
- For more information on the form and its goals, see Library of Congress, “The Nonprofit Sector in the United States: A Resource Guide; Form 990,” accessed October 12, 2023, https://guides.loc.gov/nonprofit-sector/form-990. ↵
- The 990s may not be available online until several years after the end of a given fiscal year. This process is, however, being accelerated now that museums are required to e-file their 990s rather than submit paper filing, which further slows the process of making the forms publicly accessible online. ↵
- We note that 2,281,346 (62 percent) of the included tax forms had a filing period ending December 31, though 1,379,603 (38 percent) of filings did not use the standard calendar year for reporting, and the year of the filing period end date was used to assign grants from these organizations to a particular year. ↵
- Specifically, we used scikit-learn Python package’s TF-IDF Vectorizer with word-based substrings and found possible name matches in the same state as listed on the donor tax form. We assigned a preliminary match based on the possible match with the maximum cosine similarity. Matches that have either a cosine similarity above 0.75 or a cosine similarity above 0.5 and a zip code that is identical to the zip code listed by the foundation are preserved. We excluded 224,949 grants made to recipients outside of the United States. ↵
- Future researchers might turn to the American Alliance of Museums members’ records to examine the sources of institutional support. ↵
- The interquartile range (IQR), a measure of the spread of the middle 50 percent of a distribution, is $3.5 million–$21 million. ↵
- IQR: $1.7 million–$12.8 million; there are insufficient examples to establish if American art institutions on average receive significantly less contribution revenue than AAMD members (the t-test gives results that are not statistically significant with p = 0.54). ↵
- Robin Pogrebin and Matthew Goldstein, “Leon Black to Step Down as MoMA Chairman,” New York Times, March 26, 2021, https://www.nytimes.com/2021/03/26/arts/design/leon-black-moma-chairman.html. ↵
About the Author(s): Albert-László Barabási is affiliated with the Network Science Institute at Northeastern University, the Department of Medicine at Brigham and Women’s Hospital and Harvard Medical School, and the department of Network and Data Science at Central European University, Budapest. Louis Shekhtman is affiliated with the department of Information Science at Bar-Ilan University, Ramat Gan, Israel.